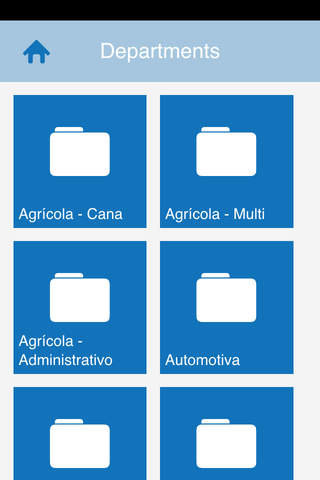
Make available the access to the information of your business with total security. Visualize your data in graphical formats through indicators and analyze the results anywhere you are.
The Lynx Dashboard is designed to give you easy and convenient access to any type of daily, weekly, biweekly, monthly, six monthly or yearly indicator, may it be financial, administrative, technical or production. You can use information extracted from several types of available database, be it an ERP system or even Excel spreadsheets. This way, it is possible for managers to analyse information wherever they are.
Key Features:
• Flexibility to construct new queries.
• Communication with any databases.
• Ability to view bar charts, line or area for each indicator.
• Possibility to include daily, weekly, biweekly, monthly, six monthly and yearly goals.
• Inclusion of comments and observations on the indicators for visualization by the users.
• Control access by the user.
• Sending of e-mails with information of indicators in one touch.
• Secure transmission of information.
• Simple to use.
To access the demo database, use the following login information.
Username: demo
Password: demo
This demonstration data is more complete from March 2014 onwards.


